VAUDE Carbon Footprint Overview
Reduce resource consumption and emissions
When resources are consumed through industrial use, climate-damaging greenhouse gas emissions are produced. We have set ourselves the goal of reducing our emissions as much as possible. We compensate for the unavoidable remainder of emissions with a myclimate climate protection project. Read more here.
This page summarizes the most important data and key figures from our carbon footprint assessment. The full document can be downloaded here.
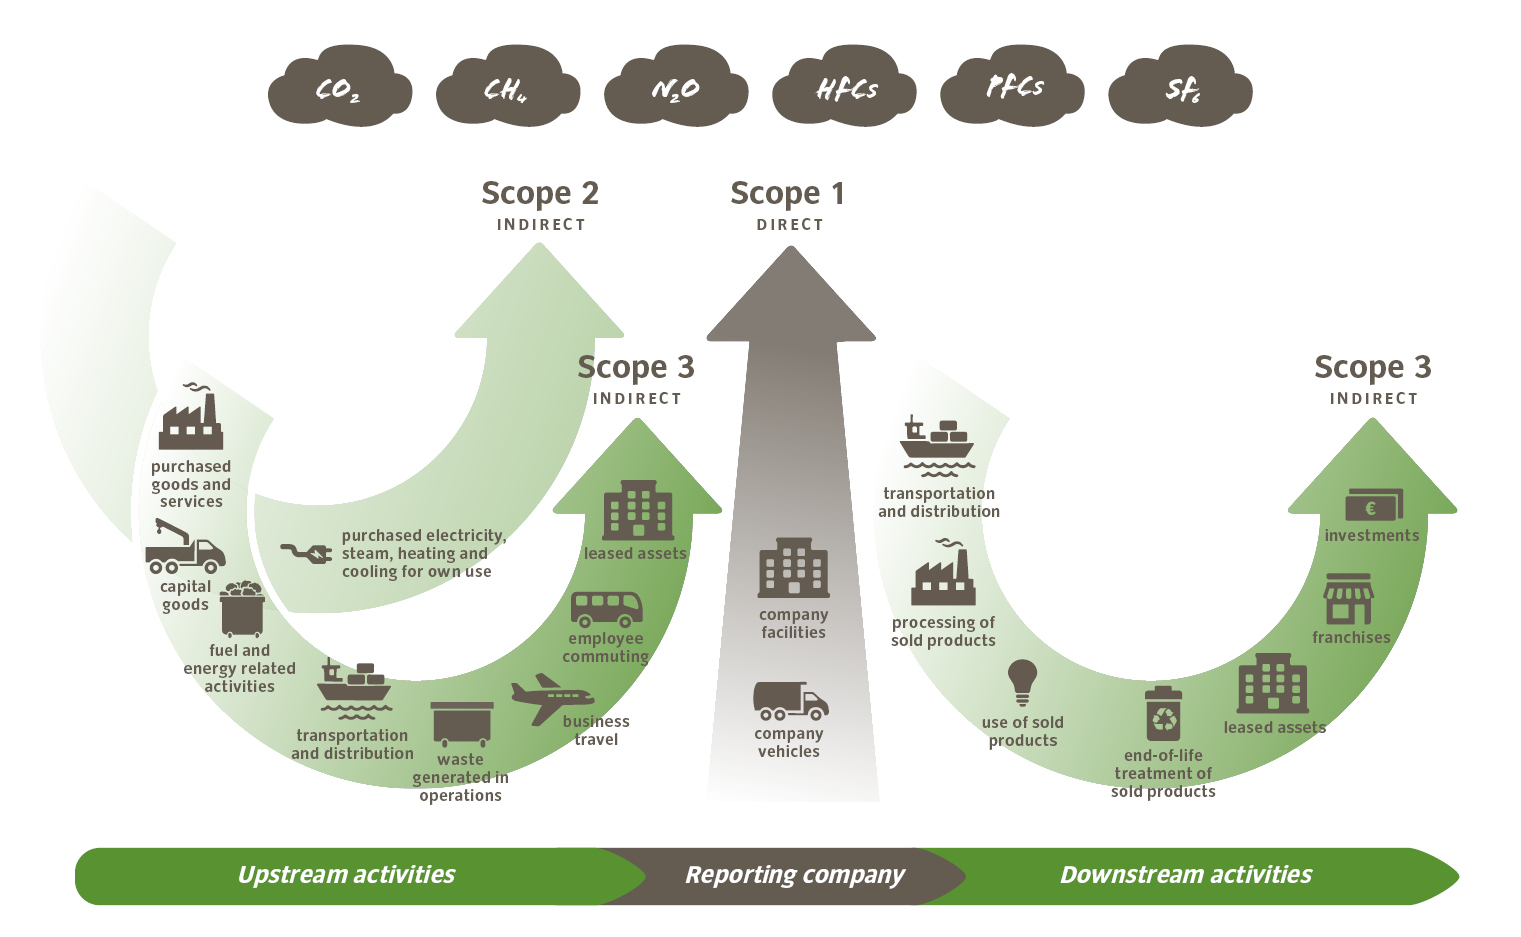
Climate footprint represents the value chain

Internal representation, Source: Climate Strategy Emissions Report, www.klimareporting.de
In the calculation of the carbon footprint, not only all the upstream and downstream processes in the value chain, but also all other greenhouse gases such as carbon dioxide equivalents are included in the carbon dioxide measurement. The unit used to measure emissions is CO₂e: "carbon dioxide equivalents".
Decoupling emissions from corporate success
Emissions will never be completely avoidable as long as our global economy is based on fossil raw materials. Thanks to climate compensation, however, VAUDE is already "climate neutral" in mathematical terms.
It is really an accomplishment when a company can grow faster than its emissions output. This is what is meant by ‘decoupling’.
For example, the emissions of our Manufaktur: when they don’t grow faster than our production volume (or even decrease) thanks to better utilization of the machines, less energy consumption or higher material efficiency. Or our emissions per employee: the same number or more employees, but without higher amounts of electricity, water, material consumption, etc. – that is our goal.
Emissions per employee pro and per tonne of production output
Create your own infographicsTotal emissions have decreased
Overall, we were able to significantly reduce emissions compared with the previous year. The biggest factors in this are material consumption in our Manufaktur and the tiresome issue of transport. Both areas were responsible for fewer emissions in 2018: After the absolute production record of 2017, the Manufaktur used less materials in 2018. More about our Made in Germany production here.
At VAUDE, business travel and commuting are regularly the second highest source of emissions. Read more about "VAUDE Verkehrswende" here.
We have already explained the subject of "decoupling" above. Total emissions in 2018 were roughly at the same level as in 2015. Since 2015, however, VAUDE has grown enormously - more employees, more space, more cars, more production, more sales, etc., and so on. We were able to significantly reduce emissions in many areas (see below). Reducing emissions even further as the company grows remains a real challenge. Read more about VAUDE's sales development here.
VAUDE Emissions in Detail
Absolute quantity of emissions in tonnes of CO2e
Create your own infographicsDistribution of VAUDE emissions 2017 in tonnes of CO2e
Create your own infographicsEmissions in annual comparison in tonnes of CO2e (carbon dioxide-equivalents)
Create your own infographicsEmissions from business trips and commuting
Employee mobility is a hard nut to crack. Although VAUDE has a Mobility Concept that is often cited as ‘best practice’, make up a major proportion every year. More on our mobility concept here.
We are a long way from our goal of a 10 % reduction in employee mobility emissions by 2020 compared with 2015: In 2017, our employee mobility emissions were up 31 % compared to 2015.
Unfortunately, an increase in employees and turnover also means an increase in business travel and employee commuting. Even though we have succeeded in decoupling energy consumption from corporate growth – when it comes to mobility, we still need to find creative incentives to encourage employees to commute to work in an environmentally friendly way and to implement our strict travel policy more consistently.
More about our corporate growth here.
Information on energy consumption and emissions regarding corporate growth can be found here.
Hotel accommodation is also a source of CO2 emissions
Create your own infographicsStill more figures… Emissions in detail
Information on energy consumption and emissions in relation to company growth can be found here.
Energy: electricity and gas consumption
Create your own infographicsPackaging: cardboard and foil
Create your own infographicsConsumables
Create your own infographicsTransport: Delivery transportation of VAUDE products
Create your own infographicsAt present, we only include transport figures that relate to the materials and products that are processed and manufactured at VAUDE Manufaktur in the carbon footprint. Read more here.
And here you can find background information for VAUDE Logistics.
VAUDE Manufaktur with an excellent CO2 Balance
After a lightning strike in 2015, we built a new production facility for our Made in Germany products in 2016. Environmental protection played an important role here. We opted for a timber construction method that is the most environmentally friendly alternative from an emissions perspective, both during production and throughout its entire life cycle.
Life cycle analysis of different construction methods for the VAUDE Manufaktur
Create your own infographicsCarbon Footprint using the Greenhouse Gas Protocol
Calculation of emissions follows these myclimate principles:
- Scope 1 emissions are shown in the carbon footprint in the relevant categories as CO2 equivalents (Total Scope 1: 374.2 tCO2e).
- All greenhouse gases (GHG) are included in accordance with IPCC in the carbon footprint.
- There are no biogenic emissions.
- The base year for GRI reporting is 2014. (Starting balance for GRI reporting). Scope 1 emissions sank approx. 22 %. (2014: 482 tCO2e, 2015: 488 tCO2e, 2016: 463, 2017: 527t CO2e, 2018: 374.2t CO2e).
- The basis is the Greenhouse Gas Protocol (WRI). If assumptions are made, they are listed in the source.
- The source in almost all cases is ecoinvent 2.2 (LCA database) with GWP: 100a from IPCC (2007). Individual sources are each listed in the carbon footprint.
- Consolidation approach of operational control (in accordance with WRI: ghg protocol)
Emissions based on scopes
Create your own infographics| GRI: | 305-1 |
| GRI: | 305-2 |
| GRI: | 305-3 |
| GRI: | 305-4 |
| GRI: | 305-5 |


