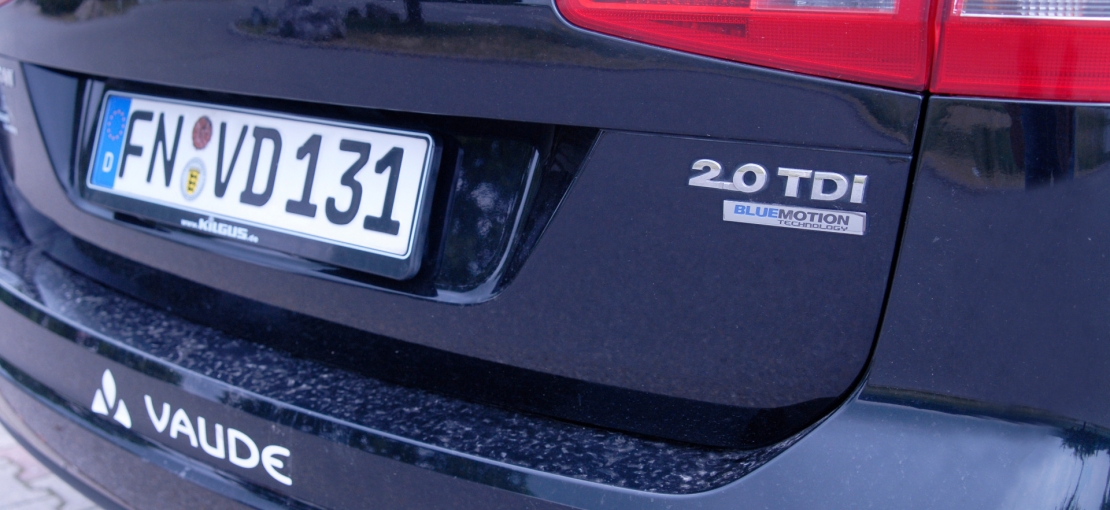
Fuel consumption in comparison
Fuel for cars and forklifts
We use diesel and gasoline at VAUDE for the company's fleet, as well as LPG for our forklifts. The LPG used by VAUDE comes from non-renewable sources.
The following table reflects consumption:
|
|
2008 | 2008 | 2008 | 2013 | 2013 | 2013 | 2013 | 2014 | 2014 | 2014 | 2014 |
|---|---|---|---|---|---|---|---|---|---|---|---|
|
|
Unit (consumption) |
kWh |
+/- to base year 2008 |
Unit (consumption) |
kWh |
+/- to base year 2008 |
+/- to previous year 2012 |
Unit (consumption) |
kWh |
+/- to base year 2008 |
+/- to previous year 2013 |
|
Liquid gas consumption for forklifts (kg) |
1.535 |
19.759 |
100% |
1.452 |
18.687 |
-5% |
+57% |
1.320 |
8.448 |
-57% |
-55% |
|
Petrol consumption (liter) |
4.993 |
45.290 |
100% |
3.966 |
35.971 |
-21% |
-2% |
6.303 |
57.168 |
+26% |
+59% |
|
Diesel consumption (liter) |
158.219 |
1.594.845 |
100% |
166.989 |
1.683.246 |
+6% |
-% |
166.318 |
1.676.485 |
+5% |
-0,40% |
|
Fuel consumption all verhicles (liters of diesel, petrol) |
163.212 |
1.640.134 |
100% |
170.955 |
1.719.217 |
+5% |
-0,3% |
172.621 |
1.733.654 |
+6% |
+1% |
Increase in LPG consumption due to renovation
The LPG consumption of our trucks decreased by 55 percent compared to the previous year. The reason for this is that VAUDE finished renovating its office building.
For the conversion from kilogram (kg) of liquefied petroleum gas in kilowatt-hours (kWh), we have used the information on the Ostsee-Gas website.
5% less fuel per 100 kilometers
Fuel consumption for the company fleet is virtually unchanged at an slightly increased driving distance (+ 1%). It is encouraging that the average consumption per 100 kilometers driven has decreased by 5%. Here the switch to low-emission vehicles and economical-driving-training is noticeable.
|
|
2013 | 2013 | 2014 | 2014 |
|---|---|---|---|---|
|
|
Unit (consumption) |
+/- to previous year 2012 |
Unit (consumption) |
+/- to previous year 2013 |
|
Kilometer driven vehicle fleet |
2.368.262 |
+2% |
2.542.981 |
+7% |
|
Fuel (liter) per 100 km driven |
7,22 |
-2% |
6,84 |
-5% |
|
Number of vehicles (year average) |
65 |
-4% |
74 |
+14% |
Diesel and gasoline are primarily produced from petroleum. We have also used a bioethanol share of five per cent in gasoline and seven percent in diesel for this calculation (Sources: Wikipedia - bioethanol, Wikipedia - biodiesel).
All figures and explanations given here relate to the VAUDE company headquarters in Tettnang-Obereisenbach. We cannot make calculations for the supply chain as yet, due to a lack of available data.


